Dataset de Nombres y Apellidos de Personas en México

Para generar un dataset representativo de los nombres de personas en México se usó una idea tomada de datamx que utiliza una base de datos abierta de la Secretaría de Educación Pública con los nombres de 1,256,438 trabajadores federalizados.

La limpieza y el procesamiento de los datos está en analizar_nombres_sep.R. Realiza lo siguiente:

  • Elimina duplicados usando como llave el CURP
  • Obtiene el género a partir del caracter 11 del CURP
  • Obtiene el año de nacimiento de los caracteres 5 y 6 del CURP
  • Calcula la edad de cada registro al año 2012 que es el de actualización según la página de la SEP
  • Calcula las frecuencias de los primeros y segundos apellidos, elimina los que tienen una frecuencia menor a 5 y elimina algunos que son basura o nulos. Crea un solo data frame y lo guarda
  • Divide el dataset en Hombres y Mujeres, calcula las frecuencias de los nombres en cada caso, elimina los que tienen una frecuencia menor a 5, calcula la edad promedio para cada nombre y guarda el data frame

Se usa un formato similar al de los nombres y apellidos frecuentes en España de donde se inspiró este proyecto. Hay que notar que es una muestra grande pero dos órdenes de magnitud menor a lo que sería una completa y que está segmentada al ser únicamente trabajadores de la SEP.

Proyecto en Github | Repositorio de Datos Abiertos

Hombres

nombre     frec   edad_media prob
1 JOSE LUIS 7028 45.13 0.0181661682257485
2 MIGUEL ANGEL 5137 41.78 0.0132782592737151
3 FRANCISCO 4853 46.73 0.0125441682412575
4 JUAN 4655 47.27 0.0120323723806004
5 JESUS 4198 44.66 0.0108511061769625
6 ALEJANDRO 4042 41.72 0.0104478730746266
7 ANTONIO 3961 46.33 0.0102385020407214
8 JORGE 3847 45.3 0.00994383169670667
9 PEDRO 3830 46.09 0.00989988962786237
10 CARLOS 3765 45.34 0.00973187583522241

Mujeres

nombre   frec   edad_media prob
1 MARIA GUADALUPE 7105 42.81 0.0122739553749732
2 LETICIA 5848 43.66 0.0101024758666915
3 PATRICIA 5422 42.41 0.00936655679705909
4 GUADALUPE 5348 43.38 0.00923872109012763
5 MARIA DEL CARMEN 4881 44.04 0.00843197412881693
6 VERONICA 4772 38.18 0.008243675587526
7 MARGARITA 4674 45.41 0.00807437965131947
8 ELIZABETH 4661 38.18 0.00805192202712881
9 SILVIA 4223 45.43 0.00729527284285882
10 ROSA MARIA 4107 46.97 0.00709488173469599

Apellidos

        apellido   frec_pri   frec_seg
3362 HERNANDEZ 44095 44333
3061 GARCIA 33010 33351
4278 MARTINEZ 31080 31087
3995 LOPEZ 30288 30188
3185 GONZALEZ 25356 25362
5960 RODRIGUEZ 22642 22490
5438 PEREZ 22470 22353
6178 SANCHEZ 21800 21782
5769 RAMIREZ 18806 18632
2924 FLORES 14160 13907

When transforming vectors to their Principal Components, are their relations preserved?


pca test


Question: When transforming vectors to their Principal Components, are their relations preserved?

We have a set of vectors. After performing Principal Component Analysis (PCA) we now use the “rotated” vectors to perform analysis. Can we be confident that the original relations (cosine similarity between vectors) are preserved on the new vector space?

knitr::opts_chunk$set(echo = TRUE)
set.seed(1234)
#Cosine Similarity
cos.sim <- function(A,B) 
{
  return( sum(A*B)/sqrt(sum(A^2)*sum(B^2)) )
}   

1 – Generate a test set y=x+err

#"noisy" x=y
x = runif(n = 1000,min=-100,max=100) # x has a uniform distribution
y = x + rnorm(n=1000,mean=0,sd=20) # y has a normal distribution

d <- data.frame(x=x,y=y)
#ver primeros puntos
head(d)
##           x            y
## 1 -77.25932 -57.56371837
## 2  24.45988  -0.03487656
## 3  21.85495  36.04947094
## 4  24.67589  22.49148848
## 5  72.18308 107.83523462
## 6  28.06212  23.19322747
plot(d)

2 – Perform PCA

pca <- prcomp(d,center = F,scale. = F)
summary(pca)
## Importance of components:
##                           PC1      PC2
## Standard deviation     83.040 13.30478
## Proportion of Variance  0.975  0.02503
## Cumulative Proportion   0.975  1.00000
pca$rotation
##        PC1       PC2
## x 0.691987 -0.721910
## y 0.721910  0.691987
dt <- pca$x #d transformed
head(dt)
##            PC1        PC2
## [1,] -95.01826  15.940928
## [2,]  16.90074 -17.681966
## [3,]  41.14781   9.168461
## [4,]  33.31222  -2.249953
## [5,] 127.79708  22.510896
## [6,]  36.16204  -4.208914
plot(dt)

3 – For a given vector, calculate it’s relation (cosine similarity) to all the others in both spaces

a <- d[2,] #choose a point on the original space
s<-apply(d,1,function(x) cos.sim(a,x)) #calculate the angles to all the other vectors
at <- dt[2,] #get the same point in the new space
st<-apply(dt,1,function(x) cos.sim(at,x)) #calculate the angles in the new space

The angles are the same

head(data.frame(s=s,st=st))
##            s         st
## 1 -0.8010403 -0.8010403
## 2  1.0000000  1.0000000
## 3  0.5171996  0.5171996
## 4  0.7381007  0.7381007
## 5  0.5550765  0.5550765
## 6  0.7698978  0.7698978

Check closest points are the same

head(data.frame(s=order(s,decreasing = T),st=order(st,decreasing = T)))
##     s  st
## 1   2   2
## 2 898 898
## 3 387 387
## 4  47  47
## 5 571 571
## 6 299 299

Answer: YES

4 – Bonus: magnitudes are also the same

magd <- sqrt(rowSums(d*d))
magdt <- sqrt(rowSums(dt*dt))

head(data.frame(magd=magd,magdt=magdt))
##        magd     magdt
## 1  96.34617  96.34617
## 2  24.45991  24.45991
## 3  42.15689  42.15689
## 4  33.38812  33.38812
## 5 129.76453 129.76453
## 6  36.40616  36.40616

5 – Bonus: you can retreive the distributions

hist(as.data.frame(dt)$PC1) #this is close to uniform

hist(as.data.frame(dt)$PC2) #this is close to normal

Looks closer than the original x,y

hist(d$x)

hist(d$y)


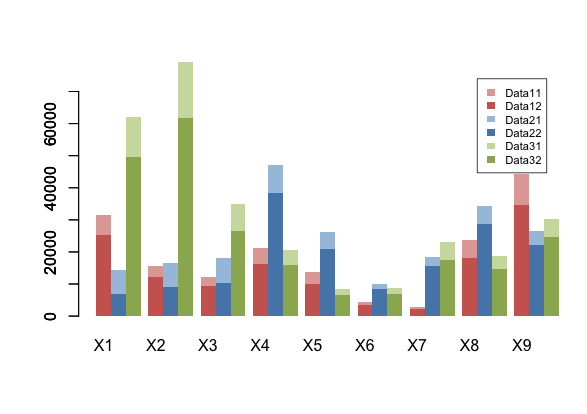
Stacked and Grouped Barplots in R

Fork on github
This is a modified version of the original barplot in the R core that lets you add more series as stacked and grouped by adding trailing space with space and a new space-before parameters.

barplot.sg(m3,space.before=0,space=2.5, col=pal1, ylim=c(0,1.2*max(m1[2,])), border=NA)
barplot.sg(m2,space.before=1,space=1.5, col=pal2 ,xaxt="n", border=NA, add=T)
barplot.sg(m1,space.before=2,space=0.5, col=pal3,xaxt="n", border=NA, add=T)

stacked and grouped barplot