Fork on github
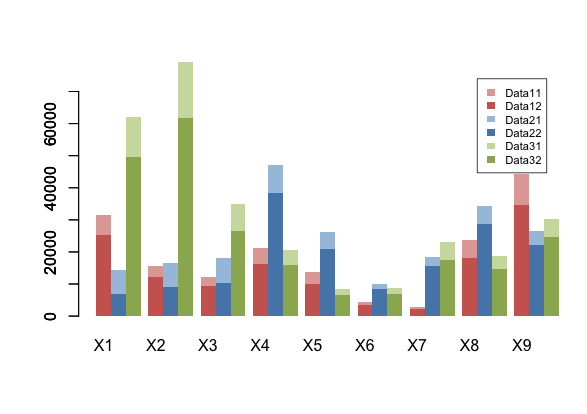
This is a modified version of the original barplot in the R core that lets you add more series as stacked and grouped by adding trailing space with space and a new space-before parameters.
barplot.sg(m3,space.before=0,space=2.5, col=pal1, ylim=c(0,1.2*max(m1[2,])), border=NA)
barplot.sg(m2,space.before=1,space=1.5, col=pal2 ,xaxt="n", border=NA, add=T)
barplot.sg(m1,space.before=2,space=0.5, col=pal3,xaxt="n", border=NA, add=T)